This is my review of D3 Start to Finish by Peter Cook. Peter is a well known author and educator in the world of data visualisation as well as being an in-demand software developer. This is his introductory tutorial to D3, a Javascript library used primarily for targetting SVG for browser native data visualisations. D3 is a very powerful tool, as a quick browse of the website will demonstrate. This book evolved from Peter’s courses on D3 and aims to teach you all you need to know to produce professional D3 based data visualisations.
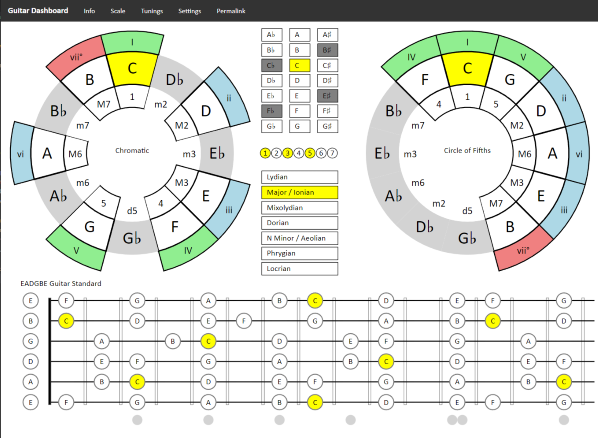
This is book was especially useful to me. I’ve been using D3 to develop Guitar Dashboard, my open-source music theory explorer for guitarists, for several years now. Guitar Dashboard is not a traditional data visualisation, the input data are scales and chords and the visualisations are a guitar fretboard and a circle of fifths, so it’s a good demonstration of D3’s power and flexibility. I learnt D3 by reading the documentation, much Googling, and trial and error, but I’ve always felt I was just scratching the surface of what it could do. Reading this in depth book taught me things about D3 that I didn’t fully appreciate and clarified many of the core concepts.
Guitar Dashboard
D3 is not a plug-and-play technology, it requires some quite serious coding to make it work. The book assumes the reader has an understanding of HTML, SVG, CSS, and Javascript. But Peter Cook has anticipated this and has another book, published alongside this, Fundamentals of HTML, SVG, CSS and Javascript for Data Visualisation which provides a good foundation.
The book is intelligently structured and well written. Peter’s experience teaching D3 courses to students of different abilities is readily apparent. The book follows the development of a relatively complex visualisation, Energy Explorer, which shows the energy mix between renewable, fossil fuels, nuclear, etc for different countries. He provides the code at the completion of each chapter so you can work along with him developing the application. I’m an experienced software developer, but I was continually impressed by the lengths Peter goes to to explain each concept carefully. I’m sure that it would be possible to work through the whole book as a relative beginner.
He takes a step by step approach, introducing each new D3 feature first and then applying that feature to Energy Explorer. Along the way we also learn some architectural strategies for web applications, including the Flux pattern, and some useful additional libraries such as Flourish and Lodash.
The core concepts of D3, and indeed the core of this book, are D3 selections and joins. To effectively master D3 one must have a good grasp of how these work. Peter takes time to thoroughly demonstrate this, using CodePen examples to both illustrate the concepts and provide a playground for the reader to experiment. He also includes more advanced concepts such as binding arrays of arrays and arrays of objects. But the book is more than just an introduction to the features of D3, it includes various strategies to produce well factored code that makes the application easy to modify and maintain. There’s much in here that would be useful for any front-end web developer regardless of their interest in D3. A nice architectural addition is his emphasis on separating the layout function from the rendering function and separating these into Javascript modules.
D3 also includes a large library of modules to help with building visualisations. Several of the most important get thorough coverage in the book, including the Fetch module for loading data from external sources, the Scale functions for mapping data to UI values, and Transitions for animating changes to a visualisation. In each case the library functions are introduced and then applied to Energy Explorer, giving a practical example of their use.
In conclusion I’d very much recommend this book to anyone who needs to rapidly get up to speed with D3, whether they are an experienced developer or a relative novice. It will give you all the tools and knowledge to create professional grade visualisations. Then it’s just up to your imagination how you want to use it.

